
Expected Default Frequency is one of those finance tools that sounds complicated but rests on a simple idea: how likely is a company to miss its debt payments? Lenders, analysts, and risk teams lean on it every day. Let’s break it down without the jargon overload.
- What Is Expected Default Frequency (EDF)?
- Why Expected Default Frequency Matters in Credit Risk Analysis
- Who Developed the Expected Default Frequency Model?
- How Expected Default Frequency Works
- Main Components of Expected Default Frequency
- What Is the Default Point in EDF?
- What Is Distance to Default?
- Expected Default Frequency Formula
- How to Calculate Expected Default Frequency Step by Step
- Expected Default Frequency Example
- Factors That Influence Expected Default Frequency
- Expected Default Frequency and the Macro Economy
- Expected Default Frequency in Commercial Lending and Risk Management
- Expected Default Frequency vs Probability of Default
- Expected Default Frequency vs Credit Ratings
- Expected Frequency vs Expected Default Frequency
- Advantages of the EDF Model
- Limitations of Expected Default Frequency
- Key Takeaways on Expected Default Frequency
- FAQs About Expected Default Frequency
What Is Expected Default Frequency (EDF)?
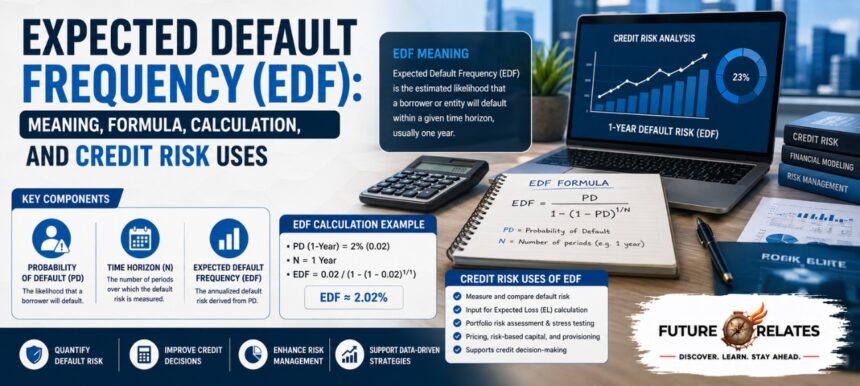
Expected Default Frequency (EDF) is a market-based credit risk measure. It estimates the probability that a company will default on its debt obligations within a set period, usually one year. Instead of relying only on accounting records, it pulls signals from the market value of a firm’s assets and how much those assets swing in value.
For readers interested in broader business and financial topics, you can also explore FutureRelates for additional business-related resources.
| Aspect | Summary |
|---|---|
| Meaning | Probability a firm defaults on its debt |
| Time horizon | Commonly one year, sometimes five |
| Main inputs | Market value of assets, asset volatility, default point |
| Formula idea | Default point ÷ market value of assets × asset volatility |
| Common uses | Lending, underwriting, stress testing, risk pricing |
Why Expected Default Frequency Matters in Credit Risk Analysis
Here’s the thing—default is expensive. When a borrower can’t pay, lenders lose money, and portfolios take a hit. Expected Default Frequency gives a forward-looking number instead of a backward glance. Because it reads live market data, it often shifts before a slow-moving credit rating does. That early warning is why so many risk teams trust it.
Who Developed the Expected Default Frequency Model?
Moody’s Analytics and the KMV Model
The EDF model is closely tied to Moody’s Analytics and the well-known KMV model. Moody’s popularized EDF as a practical credit metric used across commercial lending and corporate finance. Moody’s Analytics: EDF Model and Default Detection
Kealhofer, McQuown, and Vasicek
The KMV name comes from three people: Stephen Kealhofer, John McQuown, and Oldrich Vasicek. Their structural approach borrowed heavily from option pricing, treating a company’s equity as a call option on its assets.
How Expected Default Frequency Works
The logic is neat. A firm defaults when the market value of its assets falls below what it owes. EDF measures how close a company sits to that danger line, then converts that gap into a probability percentage. The wider the cushion, the lower the Expected Default Frequency.
Main Components of Expected Default Frequency
Market Value of Assets
This is the true, market-based worth of everything a firm owns—not the book value on paper.
Asset Volatility
Volatility, measured as standard deviation, shows how much asset value bounces around. More volatility means more uncertainty and higher default risk.
Default Point
The default point is the debt level where trouble starts. It usually blends short-term and long-term liabilities.
Default Probability
This is the final output: the percentage chance of default over the chosen horizon.
Leverage and Liability Structure
Heavier debt loads push a firm closer to its default point, raising the Expected Default Frequency.
What Is the Default Point in EDF?
The default point is the threshold where a company’s assets no longer cover its debts. A common rule counts 100% of short-term liabilities plus about 50% of long-term liabilities. When asset value slides toward this line, default risk climbs fast.
What Is Distance to Default?
Distance to Default Formula
Distance to default measures the space between a firm’s asset value and its default point, scaled by volatility:
Distance to Default (DD) = (MV − D) ÷ σ
Where MV is the market value of assets, D is the debt or default point, and σ is asset volatility.
The concept is closely related to the Merton model, a structural credit-risk approach that connects a firm’s equity value, asset value, and debt obligations. Wikipedia: Merton Model
How Distance to Default Affects EDF
Bigger distance, smaller Expected Default Frequency. When the gap narrows—through falling assets, rising debt, or wilder volatility—EDF jumps.
Expected Default Frequency Formula
Simplified EDF Formula
A simplified version found in explanatory sources looks like this:
EDF = (Default Point ÷ Market Value of Assets) × Asset Volatility
Key Inputs Required for Calculation
You need three things: the market value of assets, the default point, and asset volatility. Get those, and the rest follows.
How to Calculate Expected Default Frequency Step by Step
Step 1: Estimate Asset Value
Work out the market value of the firm’s assets, often using equity value and an option-theoretic, Black-Scholes-style approach.
Step 2: Measure Asset Volatility
Calculate the standard deviation of asset returns to capture how much value fluctuates.
Step 3: Identify the Default Point
Add short-term liabilities and a portion of long-term liabilities to set the threshold.
Step 4: Calculate Distance to Default
Plug your numbers into the DD formula to see how far the firm sits from its default point.
Step 5: Estimate Default Likelihood
Convert distance to default into a probability percentage. That’s your Expected Default Frequency.
Expected Default Frequency Example
Sample Calculation Using Asset Value, Default Point, and Volatility
Say a firm has a market value of assets of $10,000 and a default point of $4,000, with asset volatility of 35%.
Using the simplified formula: EDF = ($4,000 ÷ $10,000) × 35% = 14%.
How to Interpret the Result
A 14% Expected Default Frequency means roughly a 14% chance the company defaults within the year. That’s fairly high—lenders would price loans carefully or ask for extra protection.
Factors That Influence Expected Default Frequency
Financial Health
Strong liquidity and profitability ratios lower default risk.
Debt Burden
More leverage shortens the distance to default.
Equity Market Performance
Because EDF reads market signals, a falling stock price often lifts the number.
Macroeconomic Conditions
Recessions and slowdowns squeeze firm value across the board.
Interest Rates, Inflation, and Recession Risk
Rising rates raise debt-servicing costs, and inflation can eat into repayment capacity.
Expected Default Frequency and the Macro Economy
Interest Rate Effects on EDF
Higher short-term interest rates make debt pricier to carry, nudging EDF upward.
Risk Premiums and Corporate Investment
When risk premiums climb, corporate investment often cools, weakening firm balance sheets.
Household Consumption and Aggregate Demand
Softer household consumption and shrinking aggregate demand hurt revenue, which feeds back into default risk.
Expected Default Frequency in Commercial Lending and Risk Management
Banks use EDF for loan underwriting, counterparty assessment, risk-based pricing, portfolio monitoring, and stress testing. What stands out is its flexibility—it works for a single borrower or an entire credit book.
Expected Default Frequency vs Probability of Default
They overlap a lot. EDF is really a specific, market-driven flavor of probability of default, built on asset value and volatility rather than pure accounting inputs.
Expected Default Frequency vs Credit Ratings
Credit ratings move slowly and rely on analyst judgment. Expected Default Frequency updates with the market, so it often flags stress earlier.
Expected Frequency vs Expected Default Frequency
Statistical Meaning of Expected Frequency
In statistics, “expected frequency” is simply how often you’d expect an event across a number of trials—a theoretical count.
Why the Two Terms Should Not Be Confused
To be honest, they only share a word. Expected Default Frequency is a credit risk metric, not a statistical frequency table. Don’t mix them up.
Advantages of the EDF Model
Market-Based Signal
It reflects real-time investor sentiment.
Forward-Looking Default Measure
It predicts rather than reports.
Useful for Stress Testing and Forecasting
Great for modeling default behavior under different economic scenarios.
Limitations of Expected Default Frequency
Model Assumptions
The option-theoretic setup leans on assumptions that don’t always hold.
Dependence on Market Data
No reliable market data, no reliable EDF.
Challenges for Private Firms
Privately held companies lack traded equity, which makes estimation harder.
Key Takeaways on Expected Default Frequency
Expected Default Frequency turns market signals into a clear default probability. It rests on asset value, volatility, and the default point, and it shines in lending, forecasting, and risk management. Use it alongside ratings, not instead of them.
FAQs About Expected Default Frequency
What does EDF mean in finance?
It’s the probability a company defaults on its debt within a set period, usually one year.
How is Expected Default Frequency calculated?
By estimating asset value and volatility, setting a default point, finding distance to default, then converting that into a probability.
What is a good EDF score?
Lower is better. A small percentage signals a wide cushion between assets and the default point.
What is the difference between EDF and default probability?
EDF is a market-based version of default probability, built on asset value and volatility.
How does macroeconomic risk affect EDF?
Rising rates, inflation, and recessions weaken firm value and lift Expected Default Frequency.
For More Information Visit: https://futurerelates.co.uk/