
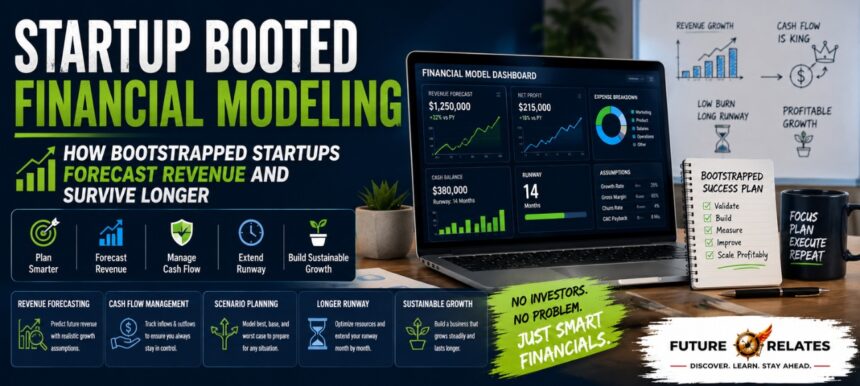

Most founders don’t fail because their idea was bad. They fail because they ran out of cash before they figured out what worked. That’s the quiet truth behind Startup booted financial modeling — a way of planning your money that keeps you alive long enough to win. If you’re building without a big check from investors, this guide is written for you.
- What Is Startup Booted Financial Modeling?
- Why Startup Booted Financial Modeling Matters More Than Ever
- The Core Philosophy Behind a Bootstrapped Financial Model
- The 5 Pillars of Startup Booted Financial Modeling
- The Three Financial Statements Every Founder Must Understand
- Bottom-Up vs Top-Down Forecasting for Startups
- Key Startup Metrics to Track in Your Financial Model
- How to Build a Startup Booted Financial Model Step by Step
- Real Example of Startup Booted Financial Modeling
- Common Financial Modeling Mistakes Startups Make
- Best Tools and Templates for Startup Financial Modeling
- How Often Should Founders Update Their Financial Model?
- Can a Bootstrapped Financial Model Help With Fundraising Later?
- Final Thoughts on Startup Booted Financial Modeling
- FAQs
What Is Startup Booted Financial Modeling?
Startup booted financial modeling is the practice of forecasting revenue, expenses, cash flow, and runway when you’re funding the business yourself. No venture capital safety net. Just you, your customers, and the money coming in and out.
Simple definition for beginners
Think of it as a working map of your business finances. You lay out how much money you expect to earn, what you’ll spend, and how long your cash will last. It’s usually a spreadsheet, and it answers one big question: will we still be here in 12 months?
Why “booted” means bootstrapped, revenue-first growth
“Booted” is shorthand for bootstrapped. It means growth comes from real revenue, not outside funding. Every dollar spent has to earn its place. This mindset pushes you toward disciplined spending and honest numbers instead of hopeful guesses.
How it differs from VC-funded startup modeling
Here’s the thing — a VC-backed model often plans to lose money for years while chasing scale. A bootstrapped model does the opposite. It protects cash, targets break-even early, and keeps you in control. You’re not modeling a hyper-growth story for investors. You’re modeling survival and steady, sustainable growth.
Why Startup Booted Financial Modeling Matters More Than Ever
| Focus Area | What It Solves | Common Benchmark |
|---|---|---|
| Cash flow visibility | Avoids running out of money | 12–18 months runway |
| Burn rate tracking | Controls monthly spending | $3,000–$20,000 net burn |
| Unit economics | Confirms each customer is profitable | 3:1 LTV:CAC ratio |
| Break-even planning | Shows when you stop losing money | ~89 customers example |
| Scenario planning | Prepares for downside risk | 20–30% contingency buffer |
Cash flow kills more startups than bad ideas
You can be profitable on paper and still go broke. If a client pays on Net-90 terms and your bills are due today, that 90-day gap can sink you. Cash timing, not profit, decides who survives.
Why founders need visibility before scaling
To be honest, scaling blind is dangerous. Hiring, ad spend, new tools — they all burn cash fast. A model shows you whether you can afford that next move before you make it.
How financial modeling protects ownership and reduces dilution
Every time you raise money, you give away equity. A strong bootstrapped model helps you grow on your own revenue, so you keep more of your company. That’s ownership retention in action.
The Core Philosophy Behind a Bootstrapped Financial Model
Revenue-first planning
Start with income, not dreams. Real customers and real pricing come before big spending plans.
Lean cost discipline
Keep fixed costs low. Question every subscription, contractor, and overhead line. Lean operations buy you time.
Sustainable growth over vanity metrics
Downloads and signups look nice, but they don’t pay bills. What’s interesting is that slower, profitable growth often outlasts fast, cash-hungry growth.
The 5 Pillars of Startup Booted Financial Modeling
Revenue assumptions
Base these on measurable inputs — traffic, conversion rate, pricing. A 5% trial-to-paid conversion is more believable than a wishful 20%.
Cost structure
Split costs into fixed (rent, salaries) and variable (transaction fees, hosting). Remember payroll taxes and benefits usually add 15% to 20% on top of salaries.
Cash flow forecasting
Track when money actually lands. A 30-day payment delay changes everything.
Break-even analysis
Know the exact point where revenue covers costs. That’s your survival target.
Margin buffer strategy
Always add a 10% to 15% expense buffer. Surprises happen, and a cushion keeps you steady.
The Three Financial Statements Every Founder Must Understand
Income statement or P&L
Shows revenue, costs, and profit over a period. Gross profit, operating income, net income — this is your profitability picture.
Cash flow statement
Tracks actual cash in and out. This is the one that keeps you honest about liquidity.
Balance sheet
Snapshot of assets, liabilities, and equity at a point in time.
How all three work together
The P&L tells you if you’re profitable. The cash flow statement tells you if you can pay the bills. The balance sheet ties it all together. This three-statement framework is the backbone of any serious startup financial model.
For a broader explanation of these core financial statements, you can also refer to the U.S. Securities and Exchange Commission’s investor education resources.
Bottom-Up vs Top-Down Forecasting for Startups
What top-down forecasting looks like
You start with a huge market (TAM), take a slice (SAM, SOM), and assume you’ll grab a small percentage. It’s quick, but often unrealistic.
Why bottom-up forecasting is more realistic
Bottom-up builds from your real inputs. It’s grounded in what you can actually do this month, which makes your forecast far more trustworthy.
Example using traffic, conversion rate, and pricing
Say you get 100 leads per month, convert 20% into customers, and charge $29 monthly. That’s 20 customers × $29 = $580 in new MRR. Simple, measurable, and honest.
Key Startup Metrics to Track in Your Financial Model
MRR and ARR
Monthly Recurring Revenue and Annual Recurring Revenue. Your predictable subscription income.
CAC
Customer Acquisition Cost. Spend $5,000 to get 50 customers, and your CAC is $100.
LTV
Customer Lifetime Value. If a customer pays over time and sticks around, an $800 to $2,400 LTV is common in SaaS.
Gross margin
Aim for 70% to 80% in software. Higher margins mean more cash to reinvest.
Burn rate
Net burn = cash out − cash in. If you spend $8,000 and earn $5,000, your net burn is $3,000 a month.
Runway
Runway = cash balance ÷ monthly net burn. With $60,000 in the bank and $5,000 net burn, that’s 12 months of runway.
Churn rate
The percentage of customers leaving. A 3% to 5% monthly churn is a realistic starting assumption.
Contribution margin and payback period
Contribution margin is revenue minus variable costs per customer. Payback period is how long it takes to earn back your CAC. A good target keeps LTV:CAC at 3:1 or better.
How to Build a Startup Booted Financial Model Step by Step
Step 1: Define revenue streams
List every way money comes in — subscriptions, one-time sales, add-ons.
Step 2: List fixed and variable expenses
Payroll, software, hosting, ad spend, legal, accounting. Nothing left out.
Step 3: Build a monthly cash flow forecast
Map inflows and outflows month by month, including payment lag.
Step 4: Calculate burn, runway, and break-even
Use the formulas above. Break-even hits when contribution margin covers fixed costs.
Step 5: Create best-case, base-case, and worst-case scenarios
Model a 20% revenue increase, a steady base, and a 25% to 30% sales drop. Scenario toggles help you sleep at night.
Step 6: Update actuals every month
Replace forecasts with real numbers. This monthly cadence keeps your model useful.
Real Example of Startup Booted Financial Modeling
Sample SaaS model with MRR, CAC, and churn
Imagine a SaaS at $29/month, adding 20 customers monthly, with 5% churn and a $100 CAC. Growth stays real because churn eats into gains.
Break-even calculation example
Fixed costs are $2,400. Contribution margin per customer is $27. Break-even = $2,400 ÷ $27 ≈ 89 customers. Once you cross 91 customers, you’re profitable.
Runway projection example
With $45,000 cash and a $3,000 net burn, that’s roughly 15 months of runway — enough time to reach break-even if growth holds.
Common Financial Modeling Mistakes Startups Make
Overestimating revenue
That 400% month-over-month growth assumption? It almost never happens. Stay conservative.
Ignoring churn
Churn-adjusted growth is the honest version. Skip it and your numbers lie.
Watching profit instead of cash
Profit is an opinion; cash is a fact. Track both, but respect cash first.
Forgetting one-time costs
Legal fees, equipment, setup costs — they hit hard and often get missed.
Never updating the model
A stale spreadsheet is worse than none. Refresh it monthly.
Skipping downside scenarios
Always model the survival case. A 30% revenue haircut shouldn’t kill you.
Best Tools and Templates for Startup Financial Modeling
Google Sheets vs Excel
Both work fine. Google Sheets wins for easy sharing; Excel wins for heavy formulas.
Startup financial model templates
A good startup financial model template can save 40+ hours. Look for assumptions sheets, dashboards, and scenario tabs built in.
When to use advanced software
Tools like Causal, Finmark, Baremetrics, or QuickBooks help once your data grows. Early on, a clean spreadsheet is enough.
How Often Should Founders Update Their Financial Model?
Monthly actuals vs forecast review
Once a month, compare what you planned against what happened. That variance analysis sharpens your next forecast.
13-week cash flow habit
The 13-week cash flow forecast is a founder favorite. It gives you tight, near-term cash visibility.
Metrics that need regular monitoring
Watch MRR, churn, burn rate, and runway every single month.
Can a Bootstrapped Financial Model Help With Fundraising Later?
Why disciplined models improve investor confidence
Investors often spend just 3 minutes on a model. A clean, realistic one signals operational maturity fast.
How to make your model investor-ready
Add a dashboard, clear assumptions, and honest scenarios. Show you understand your numbers.
Metrics lenders and investors care about
LTV:CAC ratio, gross margin, burn, runway, and retention. These prove your business can stand on its own.
Final Thoughts on Startup Booted Financial Modeling
Why clarity beats guesswork
A model turns fear into facts. Instead of guessing, you make decisions with data.
How founders can turn a spreadsheet into a growth system
Update it, learn from it, and let it guide hiring, pricing, and spending. Done right, startup booted financial modeling becomes your quiet co-pilot for lasting, sustainable growth.
For more business, startup, and financial insights, you can also explore Future Relates.
FAQs
What is startup booted financial modeling?
It’s a way for self-funded founders to forecast revenue, costs, cash flow, and runway without relying on outside investors, focusing on survival and profitable growth.
What should a startup financial model include?
Revenue assumptions, fixed and variable costs, a monthly cash flow forecast, burn rate, runway, break-even analysis, and best/base/worst-case scenarios.
How do you calculate startup runway?
Divide your current cash balance by your monthly net burn. For example, $60,000 ÷ $5,000 = 12 months of runway.
What is a good CAC to LTV ratio?
A healthy target is 3:1 LTV:CAC, meaning each customer is worth at least three times what you spend to acquire them. A 1:1 ratio signals trouble.
How much runway should a bootstrapped startup have?
Most founders aim to keep 12 to 18 months of runway, with a minimum cash reserve of 3 to 6 months for safety.
How often should a startup update its financial model?
Every month. Replace forecasts with actual numbers and review your 13-week cash flow to stay ahead of surprises.
For additional background on startups and entrepreneurship, see Startup company on Wikipedia.
For More Information Visit: https://futurerelates.